PLEASE MAKE SURE TO CLICK THE TEXT LINK OF EACH MAP TO VIEW THE ORIGINAL MAP URL OR CLICKING EACH MAP WILL ALSO REVEAL THE URL. THIS WILL ALLOW TO VIEW THE BEST RESOLUTION.
A correlation matrix lists the variable names down the first column and across the first row. The diagonal of a correlation matrix always consists of ones. In every correlation matrix there are two triangles that are the values below and to the left of the diagonal and above and to the right of the diagonal. A correlation matrix is always a symmetric matrix.
A similarity matrix is a matrix of scores which show the similarities between two data points. They are generally used in sequence alignment. The higher the score the more similar characters it receives.
Stem and leaf plot is a way to show quantitative data in a graphical format to help visualize the distribution among categories. It came about from teh work of Arther Bowley in the early 1900's.
Above is an example of an Index value plot is "of Average Streamflow Index, plotted as the red line on the above graphs, is calculated each day as the average of the streamflow index values for all the stream gaging stations in the state or water resource region having at least 30 years of record".
This technique assigns shadings proportional to the data values so that these choropleth maps do not have to classify the data. This method of mapping has not been generally accepted because many cartographers claim that they lose the ability to direct the message of communication.
This dataset is a 30 meter digital elevation model of the seven county Twin Cities metropolitan area. The data represent an elevation surface of the TCMA in a regular grid where each grid cell is a 30 meter by 30 meter square with a single elevation value for each cell given in feet above mean sea level.
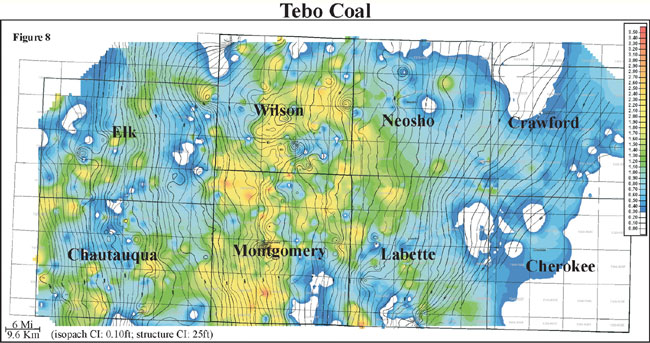
Thickness of the Tebo coal ranges in thickness from 0 to 3 feet with an average of 0.9 feet and a distribution slightly skewed to the minimum (0 to 1 m, average of 0.3 m). Isopach mapping of the Tebo coal reveals a coal that stays fairly consistent in thickness over an average of 5 miles. http://www.kgs.ku.edu/PRS/Coal/gifs/tebo-SM.jpg
Isohyets are contour lines that connect equal bands of rainfall. This map taken from the Hong Kong Observary shows the variance in the rainfall levels throughout the city.
An example of Isotachs over the western United States. Isotachs are contour lines that display points of equal wind velocity. http://www.wrh.noaa.gov/wrh/SLCw38.jpg
Above is an example of Isobars showing the different levels of air pressure above Australia. Isobars are illustrated by contour lines which display the different levels of air pressure in the atmosphere; these maps are used as part of the weather predicting process.