PLEASE MAKE SURE TO CLICK THE TEXT LINK OF EACH MAP TO VIEW THE ORIGINAL MAP URL OR CLICKING EACH MAP WILL ALSO REVEAL THE URL. THIS WILL ALLOW TO VIEW THE BEST RESOLUTION.
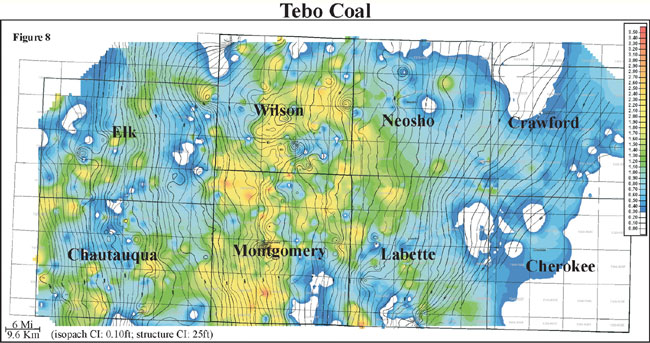
Thickness of the Tebo coal ranges in thickness from 0 to 3 feet with an average of 0.9 feet and a distribution slightly skewed to the minimum (0 to 1 m, average of 0.3 m). Isopach mapping of the Tebo coal reveals a coal that stays fairly consistent in thickness over an average of 5 miles. http://www.kgs.ku.edu/PRS/Coal/gifs/tebo-SM.jpg
Isohyets are contour lines that connect equal bands of rainfall. This map taken from the Hong Kong Observary shows the variance in the rainfall levels throughout the city.
An example of Isotachs over the western United States. Isotachs are contour lines that display points of equal wind velocity. http://www.wrh.noaa.gov/wrh/SLCw38.jpg
Above is an example of Isobars showing the different levels of air pressure above Australia. Isobars are illustrated by contour lines which display the different levels of air pressure in the atmosphere; these maps are used as part of the weather predicting process.


 An example of Isotachs over the western United States.


